Conditional Formatting
Conditional formatting enables use of certain formats on groups of cells (ranges), when some condition is satysfied. That can be helpful when you are analysing your
data. Sheet can have multiple conditional formatting rules for different ranges at the same time. Rules are associated with styles that are used on cells.
Example
The example shows top 5 companies by revenue in 2013 (source Wikipedia). This table also shows
market capitalization and number of employees. As you can see in the picture, there are two companies from USA and China, and one from Netherlands. Companies from USA have red
background color, from China yellow, and from Netherlands blue, which is achieved through conditional formatting.
On other columns IconSet, DataBar, ColorScale conditional formattings are used. Revenue and market capitalization columns have IconSet conditional formatting rules, which use icons to show data differences. Employees column has blue
DataBar rule, which shows horizontal bars whose width is proportional to cell's values.
var workbook = new Workbook(); //creating workbook and adding sheet
var companiesSheet = new Sheet("CompaniesByRevenue");
workbook.Sheets.AddSheet(companiesSheet);

companiesSheet.Columns[0].Width = 5;
companiesSheet.Columns[1].Width = 30;
companiesSheet.Columns[2].Width = 25;
companiesSheet.Columns[3].Width = 25;
companiesSheet.Columns[4].Width = 15;

var headingStyle = new CellStyle(); //define bold and centered header style
headingStyle.Font.Bold = true;
headingStyle.Alignment.Horizontal = HorizontalAlignment.Center;

var thousandsFormatStyle = new CellStyle(); //adding thousands separator format on Employees column
thousandsFormatStyle.Alignment.Horizontal = HorizontalAlignment.Center;
thousandsFormatStyle.Format = "#,#0";

var currencyFormatStyle = new CellStyle(); //adding $ (dollar) sign on Revenue and Capitalization columns
currencyFormatStyle.Format = "$#,#0";
currencyFormatStyle.Alignment.Horizontal = HorizontalAlignment.Center;

var table = companiesSheet["A2", "E6"];
table.GetRow(-1).SetValues("Rank", "Company", "Revenue (USD billions)", "Capitalization (USD billions)", "Employees").SetStyle(headingStyle);
table.GetColumn(0).SetValues(1, 2, 3, 4, 5);
table.GetColumn(1).SetValues("Wal-Mart Stores, Inc. (USA)", "Royal Dutch Shell (NLD)", "Exxon Mobil Corporation (USA)", "China National Petroleum (CHN)", "Sinopec Group (CHN)");
table.GetColumn(2).SetValues(469, 467, 453, 425, 411).SetStyle(currencyFormatStyle);
table.GetColumn(3).SetValues(248, 132, 406, null, 81).SetStyle(currencyFormatStyle);
table.GetColumn(4).SetValues(2200000, 90000, 76900, 1668072, 401000).SetStyle(thousandsFormatStyle);

var originFormating = new ConditionalFormatting(Range.Parse("B2:B6")); //creating ConditionalFormatting for specified range
originFormating.AddContainsText("USA", new CellStyle { Fill = CellFill.BackColor(Color.Red) });
originFormating.AddEndsWithText("(NLD)", new CellStyle { Fill = CellFill.BackColor(new Color("#0096FF")) });
originFormating.AddContainsText("CHN", new CellStyle { Fill = CellFill.BackColor(new Color("#FFFF96")) });

var revenueFormatting = new ConditionalFormatting();
revenueFormatting.AddRange("C2:C6"); //multiple ranges or cells can be added
revenueFormatting.AddDefaultIconSet(IconSetType.Item5Arrows); //add IconSet with 5 arrows
revenueFormatting.AddGreaterThan("460", new CellStyle { Font = new CellFont { Underline = FontUnderline.Single } });

var capitalizationFormatting = new ConditionalFormatting(Range.Parse("D1:D6")); //specifying range in constructor
capitalizationFormatting.AddColorScale(Color.Yellow, Color.Orange);
capitalizationFormatting.AddDefaultIconSet();
capitalizationFormatting.AddIsBlank(new CellStyle { Fill = CellFill.BackColor(Color.Red) }); //add style applied on blank cell

ConditionalFormatting employeesNumberFormating = new ConditionalFormatting(Range.Parse("E1:E6"));
employeesNumberFormating.AddDefaultDataBar(Color.Blue); //adding blue data bar conditional formatting rule

//adding different conditional formattings to sheet
companiesSheet.ConditionalFormatting.Add(originFormating);
companiesSheet.ConditionalFormatting.Add(revenueFormatting);
companiesSheet.ConditionalFormatting.Add(capitalizationFormatting);
companiesSheet.ConditionalFormatting.Add(employeesNumberFormating);

workbook.Save(@"ConditionalFormatting.xlsx");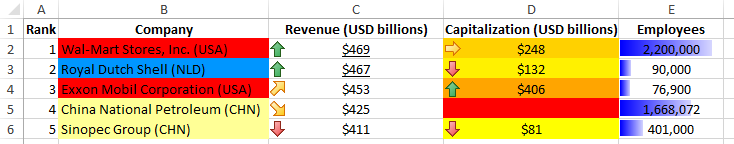
Basics
Sheet can have multiple conditional formattings applied on different ranges. Every conditional formatting has rules that are applied on it's ranges. Every rule has a style which is applied when a certain condition is satysfied. Conditional formatting rules are classified into two groups:
With specified style(LessThan, Equal, UniqueValues, ContainsBlanks, BeginsWith, AboveAverage etc.)Without specified style(ColorScale, DataBar and IconSet)
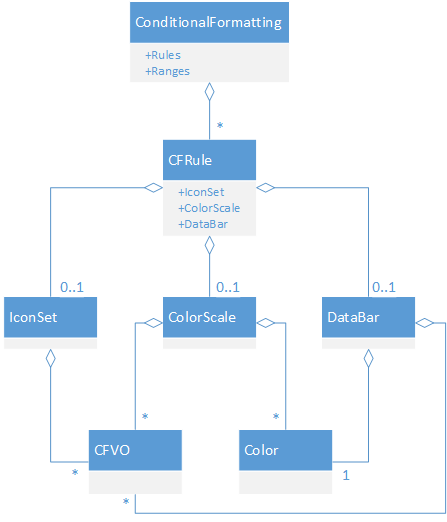
UML diagram of conditional formatting without specified style is shown in the picture. One ConditionalFormatting is applied on set of ranges, and it can have multiple rules. Each rule can aggregate ColorScale, DataBar or IconSet (one of them). ColorScale, DataBar and IconSet has multiple CFVOs (Conditional Formatting Value Objects).
ColorScale has multiple colors corresponding to CFVOs. DataBar has only one color, which represents color of the already mentioned horizontal background bar.
Conditional formattings with specified style are achieved through properties of CFRule object. ConditionalFormatting object behaves like factory for all CFRule objects.
CFVO class consists of type and value properties. Conditional formatting rules without specified style use them to define conditions.
ColorScale
ColorScale represents conditional formatting rule with it's own style. It is presented through setting background colors of cells based on certain thresholds of cell's values. Every threshold is associated with color. Thresholds are represented through CFVO. Most commonly used ColorScales are 2ColorScale and 3ColorScale. You can create them easily :
conditionalFormatting.AddColorScale(Color minimum, Color maximum) //2ColorScale
conditionalFormatting.AddColorScale(Color minimum, Color midpoint, Color maximum, int centerPercentage) //3ColorScale
3ColorScale has 3 colors (minimum, midpoint, maximum) and centerPercentage (defaults to 50%) as a threshold for which midpoint color is used.
Colors can be specified through HEX or RGB notation, or you can use some of the static color properties: White, Black, Red, Green, Blue, Yellow, Pink, Orange, Purple, Cyan,
Magenta etc. for Example Color.Red.
Because certain colors in ColorScales are used commonly, you can create default two and three ColorScales:
conditionalFormatting.AddDefaultTwoColorScale() //default 2ColorScale
conditionalFormatting.AddDefaultThreeColorScale(int centerPercentage) //default 3ColorScale
Default 3ColorScale uses these colors:
Red- for minimum valueYellow- for midpoing value (determined by centerPercentage which defaults to 50%)Green- for maximum value
Default 2ColorScale is similar, it doesn't use midpoint color. It just creates gradient between red and green. Sometimes it is important to create custom thresholds. CFVO objects are used for that purpose. CFVO object consists of type and value. CFVO types are: Num, Percent, Max, Min, Formula and Percentile. When you specify Min or Max, value is not needed, because it is represents minimum and maximum value of ranges on which that rule is applied. Sometimes threshold needs to be a certain numeric or percentage value, in that case Num and Percent types are used and value is specified.
In the example above, market capitalization column has defined ColorScale. It is introduced by list of CFVOs and list of colors. Every CFVO corresponds to color. This example shows CFVOs for minimum and maximum values that correspond to Yellow and Orange colors respectively:
ConditionalFormatting capitalizationRules = new ConditionalFormatting(Range.Parse("D1:D6"));
      List<CFVO> cfvoList = new List<CFVO>
      {
          new CFVO
          {
              Type = CFVOType.Min
          },
          new CFVO
          {
              Type = CFVOType.Max
          }
      };
      List<Color> colorList = new List<Color>
      {
          Color.Yellow,
          Color.Orange
      };
      capitalizationRules.AddColorScale(cfvoList, colorList);
There can be arbitrary number of CFVOs and colors. ColorScale can be created by specifying those lists in AddColorScale() method.
Because Min and Max CFVO types are the most used ones, the same effect as the previous code can be achieved through:
capitalizationRules.AddColorScale(Color.Yellow, Color.Orange)DataBar
DataBar is a conditional formatting rule that shows a bar in the cell's background. Bar size is scaled cell's value compared to collection of cell's values. That collection is derived from all ranges and cells on which conditional formatting rule is applied. Color of the bar is the main parameter when crating a DataBar. In the example above, employees column has DataBar rule defined:
ConditionalFormatting employeesRules = new ConditionalFormatting(Range.Parse("E1:E6"));
employeesRules.AddDefaultDataBar(Color.Blue);
ConditionalFormatting object employeesRules is created on E1:E6 range. Arbitrary number of rules can be added to this range.
DataBar has 2 CFVOs, for starting and ending value, although ColorScale can have unbounded number of CFVOs. Those 2 CFVOs are usually minimum and maximum value.
So for default DataBar creation, you need to specify only color (in this case blue).
IconSet
IconSet is a conditional formatting rule that uses icons to represent data differences. CFVO objects are used to represent thresholds for certain icons, similar like ColorScale does. Default values are percentages divided on number of icons (for example for 3 icons it is 33%, 67% and 100% thresholds). In the example above, default IconSet with set of 5 icons is added to revenue column:
revenueRules.AddDefaultIconSet(IconSetType.Item5Arrows)
Also capitalizationRules uses AddDefaultIconSet() which represents 3Arrows IconSet type. That is similar to next call:
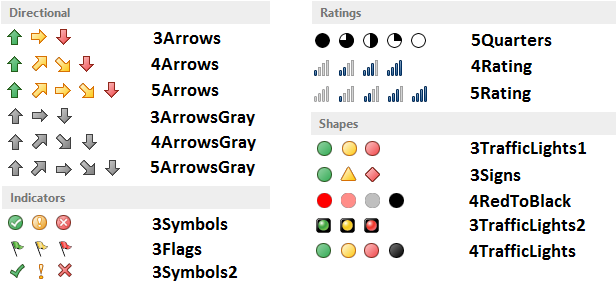
capitalizationRules.AddDefaultIconSet(IconSetType.Item3Arrows, true)True boolean value indicates whether cell shows it's value or not (defaults to true). Maybe it is needed to show only icon. There are different types of icons that can be used with IconSet conditional formatting rule. Next picture shows all IconSet types that can be used.
Text based
Text based conditional formatting rules represent conditions that cell's text value has to satysfy in order to apply specified style on it. There are 4 text based rules:
- ContainsText
- NotContainsText
- BeginsWithText
- EndsWithText
In the example above, ContainsText and EndsWithText are used:
CellStyle redFillStyle = new CellStyle();
CellFill redStyleFill = new CellFill();
redStyleFill.Background = Color.Red;
redStyleFill.Pattern = FillPattern.Solid;
redFillStyle.Fill = redStyleFill;
companyNameRules.AddContainsText("USA", redFillStyle);

CellStyle blueFillStyle = new CellStyle();
CellFill blueStyleFill = new CellFill();
blueStyleFill.Background = new Color("#0096FF");
blueStyleFill.Pattern = FillPattern.Solid;
blueFillStyle.Fill = blueStyleFill;
companyNameRules.AddEndsWithText("(NLD)", blueFillStyle);
You need to specify a string that is used by a conditional formatting rule to apply defined style. In the example you can see creation of solid background color fill style, which is commonly used.
Numeric based
Numeric based conditional formatting rules are used when cell style needs to be changed depending on the cell's numeric value. Numeric based conditional formatting
rules can be called through next methods in ConditionalFormatting object:
- AddLessThan
- AddLessThanOrEqual
- AddEqual
- AddNotEqual
- AddGreaterThanOrEqual
- AddGreaterThan
- AddBetween
- AddNotBetween
- AddTop
- AddBottom
Signature is the same for all methods. First, conditional value (in string form) is specified and than style. In the example above, all revenue values greater than $460 billions are underlined, like in the next snippet:
CellStyle underlineCellStyle = new CellStyle();
underlineCellStyle.Font.Underline = FontUnderline.Single;
revenueRules.AddGreaterThan("460", underlineCellStyle);
If you want to use AddTop and AddBottom methods, you can use percentage (defaults to false):
AddTop(50, style, true)
AddBottom(30, style, true)
If you use percent = true, than top 50% and bottom 30% satisfy condition in the previous code. If percent equals to false (which is default), than
top 50 and bottom 30 values from cell collection satisfy condition.
Average based
They are used to highlight those cells that are above or below average, or above or below standard deviation. For above and below average you can use AddAboveAverage()AddBelowAverage() methods respectively. Only style is needed. Alternatively you can use "equal to average" by specifying equal = true
(for example AddAboveAverage(style, true)). For standard deviation AddStandardDeviationAbove() and AddStandardDeviationBelow() methods are used.
Order of standard deviation (n-standard deviation) is specified as second parameter (for example AddStandardDeviationAbove(style, 2)). It defaults to 1 (first standard deviation).
Value based
You can use them to highlight unique or duplicate values through AddUniqueValues() and AddDuplicateValues() methods. Only CellStyle object is required.
AddExpression(formula, style) adds expression (or formula). If the formula result is true, the CellStyle is applied.
Blank based
Blank based conditional formatting rules are used when cell is blank or not. It can be achieved through AddIsBlank() and AddIsNotBlank() methods.
In the example above, market capitalization column has a IsBlank rule. If cell in that range is blank, background color is filled with solid red color:
CellStyle blankStyle = new CellStyle();
CellFill blankStyleFill = new CellFill();
blankStyleFill.Background = Color.Red;
blankStyleFill.Pattern = FillPattern.Solid;
blankStyle.Fill = blankStyleFill;
capitalizationRules.AddIsBlank(blankStyle);
Error based
Error based conditional formatting rules highlight cells based on whether they have errors or not. It can be achieved through AddContainsErrors() and AddNotContainsErrors()
methods. Only style needs to be created.
Time period
Time period conditional formatting rules highlight cells that contain date and time values. Time period type can have one of the next values:
- Today
- Yesterday
- Tomorrow
- Last7Days
- ThisMonth
- LastMonth
- NextMonth
- ThisWeek
- LastWeek
- NextWeek
So if you want to highlight dates in the last 7 days, the code should look like this:
ConditionalFormatting rules = new ConditionalFormatting(range);
rules.AddTimePeriod(TimePeriod.Last7Days, style);
Range and style are needed for previous code. That range should contain date values.
Adding Conditional Formatting to Sheets
Sheet can have multiple conditional formattings attached to different ranges. Each conditional formatting can have multiple rules and ranges.
Specification of rules and ranges is required when creating ConditionalFormatting object. Also you can add single cells that participate in
conditional formatting rules (CFRule objects). In the next code sample, you can see how to add ranges and cells in conditional formatting:
ConditionalFormatting rules = new ConditionalFormatting(Range.Parse("A1:B2"));
Range range = new Range(Cell.Parse("D1"), Cell.Parse("E2"));
rules.AddRange(range);
rules.AddCell(new Cell(3, 0)); //effectively A4
Ranges A1:B2 and D1:E2 and cell A4 participate in conditional formatting "rules". You can specify range in constructor of ConditionalFormatting
object or add it through AddRange() method. AddCell() method adds cell to conditional formatting, and all rules within are going to be
applied on it, if it satisfies condition. After adding ranges and cells, rules are added to conditional formatting.